UPS Runtime Calculator
Estimate UPS / battery-backup runtime from battery voltage, capacity, series / parallel arrangement, load wattage, inverter efficiency, and depth of discharge. Includes a Peukert warning at high discharge rates.
Interactive tool
Presets
Battery Bank
Load and Derating
Runtime
What is the UPS Battery Backup Time Calculator?
A practical runtime estimator for battery-backed loads: home UPSs, server racks, solar storage, telecoms, you name it. Inputs are the per-battery voltage and Ah, the series × parallel arrangement, the load wattage, the inverter efficiency, and the usable depth of discharge. The output is hours-and-minutes of runtime plus a warning when the discharge rate is heavy enough that the Peukert effect will degrade the real number.
How to Use the Calculator
- 1Enter the per-battery voltage and Ah (e.g. 12 V / 100 Ah for a typical AGM)
- 2Enter the series count (raises bank voltage) and parallel-string count (multiplies Ah)
- 3Enter the load wattage your UPS will be feeding
- 4Pick an inverter efficiency (0.85 is a safe default for online double-conversion)
- 5Pick a depth of discharge (0.5 for long cycle life, 0.8 to 0.9 for emergency-only)
- 6Read off the runtime, with a Peukert warning at high discharge rates
Key features
Series + parallel banks
Bank voltage = V_batt × series; bank Ah = Ah × parallel strings
Inverter efficiency
Accounts for the DC → AC conversion loss (default 0.85)
Depth of discharge
You can’t use 100% of an Ah rating without damaging the battery; default 0.8
Peukert warning
Flags discharge rates above 0.5C where lead-acid real runtime departs from linear
Common presets
Desktop, server rack, small office, home-critical scenarios
Live evaluation
Updates as you type: no submit button
Why a UPS Runtime Calculator?
Vendor "runtime curves" are advertising. They’re measured under ideal conditions, with brand-new batteries, at moderate temperature, at a specific discharge rate. For real designs you need to model the bank topology, inverter loss, depth of discharge, and discharge rate explicitly. This tool does exactly that, and it flags the case where the Peukert effect makes the linear estimate optimistic.
Common use cases
- Spec the battery bank for a server-room UPS
- Estimate emergency runtime for a home critical-loads circuit
- Compare two battery chemistries (AGM vs LiFePO4) at the same Wh
- Size a solar storage bank for autonomy hours
- Sanity-check a UPS vendor’s claimed runtime against your actual load
Formulas
- Bank V = V_batt × seriesCount
- Bank Ah = Ah × parallelStrings
- Total Wh = Bank V × Bank Ah
- Usable Wh = Total Wh × DoD × η
- Runtime = Usable Wh / Load W
- C-rate = LoadAmps / Bank Ah (LoadAmps = LoadW / (BankV × η))
Peukert effect, briefly
Lead-acid capacity is rated at a slow discharge (often 20-hour rate). At higher rates, more energy is wasted as heat and the chemical reaction can’t keep up, so usable Ah drops. Above 0.5C this becomes significant. Lithium chemistries (LiFePO4, NMC) are much less sensitive, but still derate at high C-rates per their datasheet.
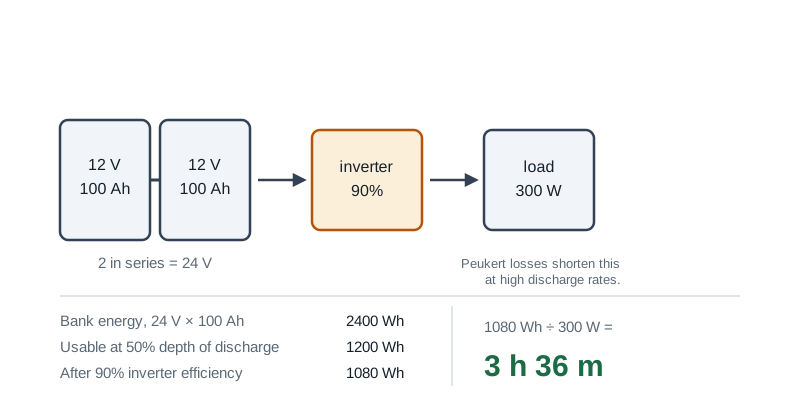
UPS runtime chart: a 24 V 100 Ah bank
Runtime for a 2400 Wh bank at 50% depth of discharge through a 90% efficient inverter, which leaves 1080 Wh usable. Halve the load and the runtime roughly doubles.
| Load | Usable energy | Runtime | Typical equipment |
|---|---|---|---|
| 100 W | 1080 Wh | 10 h 48 m | router, ONT and a small switch |
| 200 W | 1080 Wh | 5 h 24 m | network rack, NAS idling |
| 300 W | 1080 Wh | 3 h 36 m | desktop and one monitor |
| 500 W | 1080 Wh | 2 h 10 m | small server or workstation |
| 750 W | 1080 Wh | 1 h 26 m | server with drives spinning |
| 1000 W | 1080 Wh | 1 h 05 m | rack under real load |
The high load rows are optimistic. Lead acid capacity falls as the discharge rate rises, an effect described by Peukert law, so a bank rated at the 20 hour rate delivers noticeably less when drained in an hour. Lithium is far less affected.
Tips & best practices
Lithium vs lead-acid
LiFePO4 lets you safely use ~90% DoD daily with thousands of cycles. Lead-acid life drops sharply above ~50% DoD. For a given Wh, lithium delivers much more real-world runtime.
Round trip efficiency
For "off-grid" or "solar" use cases, also derate by the charge efficiency on the way in. AGM round-trip is ~80%, LiFePO4 round-trip is ~95%.
Temperature matters
All chemistries lose capacity at low temperatures. At -10 °C, AGM may deliver only ~60% of rated Ah. Locate the bank somewhere warmer than the outdoor minimum.
Privacy & security
Everything runs in your browser; no values leave your device.
Related tools
- LED Resistor Calculator
Size the current-limiting resistor for a single LED, an LED chain in series, or several LEDs in parallel. Picks the nearest standard E-series value and recommends a safe wattage rating.
Electronics & Embedded
- Motor Full Load Current Calculator
Compute motor full-load current (FLA / FLC) for DC, single-phase, and three-phase motors from horsepower or kilowatts, efficiency, and power factor. Side-by-side NEC 430.250 reference.
Electronics & Embedded
- Ohm’s Law Calculator
Solve Ohm’s law for voltage, current, resistance, or power. Enter any two of V, I, R, and P and instantly get the other two with step-by-step derivations.
Electronics & Embedded
- Wire Size Calculator
NEC wire size calculator. Sizes copper or aluminum against Table 310.16 ampacity with ambient and conduit-fill derating, then against your voltage drop target, and reports which limit decided it.
Electronics & Embedded
- 555 Timer Calculator
Design an NE555 astable oscillator or monostable one-shot. Pick R1, R2, C and read off frequency, period, duty cycle, and pulse width, with an inline schematic.
Electronics & Embedded
- Power Factor Correction Calculator
Compute kVAR and capacitance per phase needed to raise an installation from its current power factor to a target. Before/after power-triangle diagram and current-reduction estimate.
Electronics & Embedded
Frequently Asked Questions
How is UPS runtime calculated?
Bank energy in Wh = V_batt × series × Ah × parallel. Usable energy = Wh × DoD × η (inverter efficiency). Runtime in hours = Usable Wh / Load W. This is a linear model and is optimistic at high discharge rates due to the Peukert effect.
What depth of discharge should I use?
For lead-acid / AGM in cyclic service, 0.5 (50%) is the standard for good cycle life. For emergency-only standby use you can go to 0.8. For LiFePO4 you can safely run 0.9 daily. The default 0.8 is a reasonable middle ground for the typical UPS scenario.
What inverter efficiency is realistic?
A modern double-conversion online UPS is around 0.90 to 0.95 in normal operation. Line-interactive UPSs are higher in normal operation (0.95+) but drop slightly during the inverter handoff. Use 0.85 for a conservative number that covers older / lower-end hardware.
When does the Peukert warning matter?
Above ~0.5C discharge rate, lead-acid / AGM batteries deliver noticeably less energy than the Ah rating implies. The tool flags this threshold so you know the linear runtime is optimistic. Lithium chemistries are much less affected but still derate at very high C-rates.
What about temperature effects?
Battery capacity drops with temperature. At -10 °C, AGM may deliver only ~60% of nameplate Ah. Locate the bank somewhere warmer than the outdoor minimum. The tool doesn’t derate for temperature: build that margin into your DoD if needed.
Is anything sent to a server?
No: everything runs in your browser. No values, results, or interactions are uploaded.
How do I convert VA to watts for a UPS?
Multiply the VA rating by the power factor, which is typically 0.6 on older units and 0.9 to 1.0 on modern ones. A 1000 VA UPS at 0.6 delivers 600 W, so a 700 W load will not run on it at all regardless of what the box says. Always size against the watt figure.
Why does my UPS run for less time than the calculation says?
Three usual reasons. Lead acid capacity falls as the discharge rate rises, so a bank rated over 20 hours delivers less in one. Batteries lose capacity with age, often 20% or more after three years. And the inverter draws its own idle power whether or not anything is plugged in.